33
Preclinical evidence
P R O B E
• V o l . L I I I • N o . 3 • A p r – J u n 2 0 1 4
Mitra SK, et al.
Effect of Cystone on Glycolic Acid-induced Uroliathiasis
conditions and maintained on 12 h
light and dark cycle. The rats were fed
with commercially available standard
pelleted feed (Lipton India Ltd,
Mumbai, India) and water ad libitum.
The constituent plants of the
formulation were procured from
authentic sources and identified by
a botanist of The Himalaya Drug
Company. A voucher specimen
was deposited in the herbarium of
the R&D Center, Bangalore. All
plant powders were individually
weighed and mixed. The drug was
administered as an aqueous oral
suspension and the animals of the
control group received water as
vehicle.
The rats were divided into 5 groups
of 8 each. Rats of group 1 received a
commercial diet and served as control,
group 2 was fed with a calculi-
producing diet (CPD - commercial
diet mixed with 3% glycolic acid) for
42 days. Groups 3, 4, and 5 received
250, 500, and 750 mg/kg body weight
of Cystone, respectively once a day
orally in addition to the CPD for the
same duration.
Collection and analysis of
urine samples
On day 42, immediately after
administration of the respective
assigned doses, the rats were housed
in metabolic cages for 24 h urine
collection. A drop of concentrated
hydrochloric acid was added to
the collected urine and stored at
4°C. Levels of oxalate, calcium,
and inorganic phosphorus were
determined spectrophotometrically.
Sodium and potassium were estimated
using a flame photometer.
Assay of renal tissue
samples
At the end of the experiment, on day
43, the rats were killed by cervical
dislocation and kidneys excised,
washed with normal saline and
weighed. The kidneys were dried
at 80°C in a hot air oven. A sample
of 100 mg of the dried kidney was
broiled in 10 mL of 1N hydrochloric
acid for 30 min. The kidneys were
then homogenized. The homogenate
was centrifuged at 2000 rpm for 10
min and the supernatant separated.
The estimation of oxalate and calcium
was carried out by the method of
Hodgkinson and Williams (1972) and
Tsuyoshi Ohnishi (1977), respectively.
Statistical analysis
The data of urinary and renal
parameters were expressed as mean ±
SEM. The results were analyzed
statistically using ANOVA followed by
Dunnett
t
test. The minimum level of
significance was fixed at
P
< .05.
Results andDiscussion
Urinary supersaturation with respect
to stone-forming constituents is
generally considered to be one of the
causative factors in calculogenesis.
In this context, the changes in
urinary oxalate levels are relatively
much more important than those
of calcium. In the present study,
feeding 3% glycolic acid resulted in
hyperoxaluria, which is known to
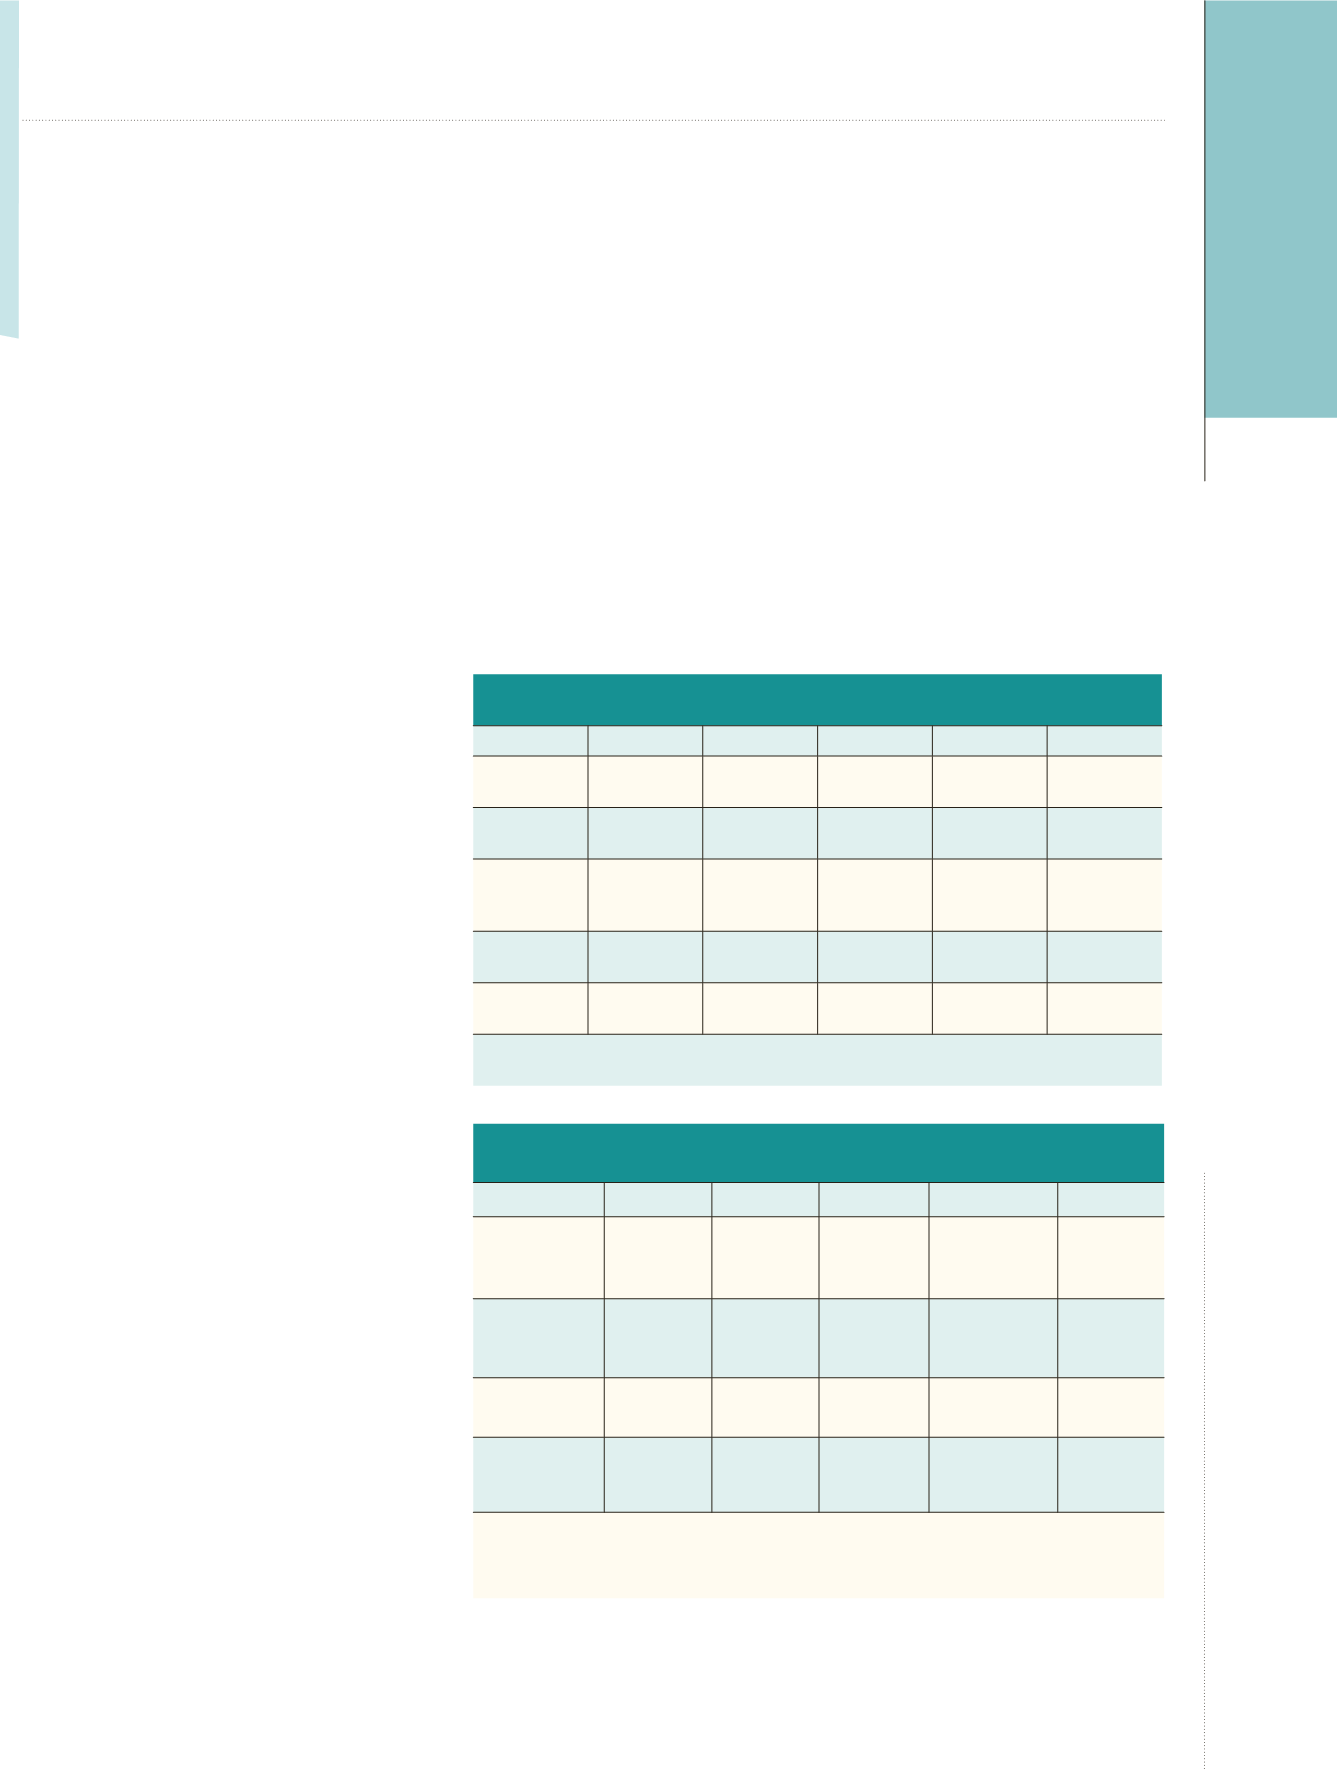
Table 1. Effect of Cystone on Calculi-forming Constituents in Urine Following 3% Glycolic Acid
for 42 Days (n = 8)
Parameter
Group 1
Group 2
Group 3
Group 4
Group 5
Oxalate
(mg/24 h)
12.30
c
±
0.84
25.12 ±
2.89
18.89 ±
3.37
13.10
b
±
2.95
12.92
b
±
2.81
Calcium
(mg/24 h)
4.26
c
±
0.19
7.18 ±
0.74
5.90 ±
0.92
3.89
b
±
0.36
3.87
b
±
0.42
Inorganic
Phosphorus
(mg/24 h)
0.923
b
±
0.128
1.596 ±
0.182
1.119 ±
0.120
0.818
b
±
0.136
0.800
b
±
0.122
Sodium
(mEq/24 h)
10.21
c
±
0.94
4.23 ±
0.79
6.58
a
±
0.82
10.13
c
±
1.12
10.48
c
±
1.30
Potassium
(mEq/24 h)
11.76
c
±
0.91
6.49 ±
0.69
8.46 ±
1.54
10.81 ±
1.98
10.02 ±
2.14
Values are expressed as mean ± SEM.
a
P
< .05;
b
P
< .01; and
c
P
< .001 compared with group 2.
Table 2. Effect of Cystone on Kidney Weight and Calculi-forming Constituents in Kidney
Following 3% Glycolic Acid for 42 Days (n = 8)
Parameter
Group 1 Group 2 Group 3
Group 4
Group 5
Wet Weight
(g/100 g body
weight)
0.340
c
±
0.0054
0.423 ±
0.0084
0.400
b
±
0.019
0.358
c
±
0.012
0.350
c,e
±
0.009
Dry Weight
(g/100 g body
weight)
0.087
c,d
±
0.0018
0.119 ±
0.0015
0.112
b
±
0.0020
0.096
c,g
±
0.0022
0.094
c,g
±
0.0016
Oxalate (mg/
100 mg tissue)
0.449
c,d
±
0.018
1.103 ±
0.056
0.895
a
±
0.061
0.563
c,g
±
0.031
0.548
c,f
±
0.039
Calcium (mg/
100 mg tissue)
0.168
c,d
±
0.0061
0.359 ±
0.012
0.309
a
±
0.016
0.216
c,g
±
0.013
0.211
c,f
±
0.020
Values are expressed as mean ± SEM.
a
P
< .05,
b
P
< .02, and
c
P
< .001 compared with group 2;
d
P
< .01 group 1 versus
groups 4 and 5;
e
P
< .05,
f
P
< .01, and
g
P
< .001 group 3 versus groups 4 and 5.


