29
Clinical insight
P R O B E
• V o l . L I I I • N o . 3 • A p r – J u n 2 0 1 4
Thus, depending on the concentration
C
H
, that is, on the sign of Δ
m
(ie, Δ
m
< 0 during growth, Δ
m
< 0 during
dissolution), growth or dissolution of
CaOX concrements can be achieved
simply by changing the concentration
C
H
of the HA added.
Results
Clinical laboratory data
Table 1 shows reports by our
laboratory on the urinary excretion
of calcium, oxalate, creatinine,
and others responsible for CaOX
crystallization substances. Mainly,
urine concentrations of calcium and
oxalate are responsible for CaOX
urine supersaturation, according to
leading researchers. However, given
the complexity of the pathogenesis
of CaOX renal calculosis, the mean
values of renal calculosis reagents
(calcium [Ca
2+
] and oxalate [C
2
O
4
2−
])
are not expected to be elevated in all
analyzed cases. This is confirmed by
our results. Due to the dispersion of
the data, the average values of these
indicators are within the accepted
norms.
Only 10% of the patients have urinary
calcium levels above 7.5 mmol/24 h
(which is the upper limit of normal
ranges), but 39% of them have
hyperoxaluria (oxalate above 0.45
mmol/24 h).
Table 2 shows the urine excretion
(
m
mol/24 h) of amino acids,
mentioned above, in the groups of SF
patients and controls. A mathematical
estimation of the deviation from
the observation over amino acids in
patients has been made. It turned
out that in the group of SFs, the
investigated amino acid excretions
were significantly decreased about
20% for serine and about 40% for
glycine. About 75% of the SFs showed
also an excretion of HA lower than 5.6
mmol/24 h.
Table 1. Urinary Excretion of Inorganic Components and Some Trace Elements
in Patients With CaOX Calculosis
Controls
(mmol/24 h)
Stone-formers
(mmol/24 h)
P
Values
Calcium
3.9 ± 1.9
5.6 ± 2.1
< .05
Oxalate
0.3 ± 0.17
0.46 ± 0.25
< .001
Phosphorous
15.0 ± 10.4
19.2 ± 9.2
< .05
Uric acid
1.9 ± 0.7
2.3 ± 1.5
< .05
Creatinine
10.4 ± 5.2
11.8 ± 6.1
< .05
Magnesium
5.1 ± 1.9
3.9 ± 0.9
< .05
Volume, mL
1490 ± 350
1050 ± 300
< .001
pH
6.0 ± 0.4
6.1 ± 0.3
NS
Table 2. Mean ± SEM Values
(
μ
mol/24 h) of Urinary Amino
Acids in Controls and in the SFs
Amino
Acids
(μmol/24 h)
Controls
SFs
Serine
392.3 ±
92.3
240.6 ±
202.6
a
Glycine
1064.7 ±
426.1
841.5 ±
439.9
Hippuric
Acid,
mmol/24 h
19.5 ± 8.4
1.9 ±
0.6
a
SFs, stone formers.
a
P
< .001, statistically different from
controls.
Data of in vitro experiments
The solubility of CaOX in pure water
at 25°C is about 4 mg/L (3.1 × 10
-5
mol/L). The solubility of calcium
oxalate in artificial urine with zero
supersaturation is considerably
increased (8.7 × 10
-5
mol/L) compared
to its solubility, in pure water. This
fact is due to the presence of complex
ions (Mg
2+
, citrate ions, etc) in this
solution, as predicted by their stability
constant (
a
i
), which is known from
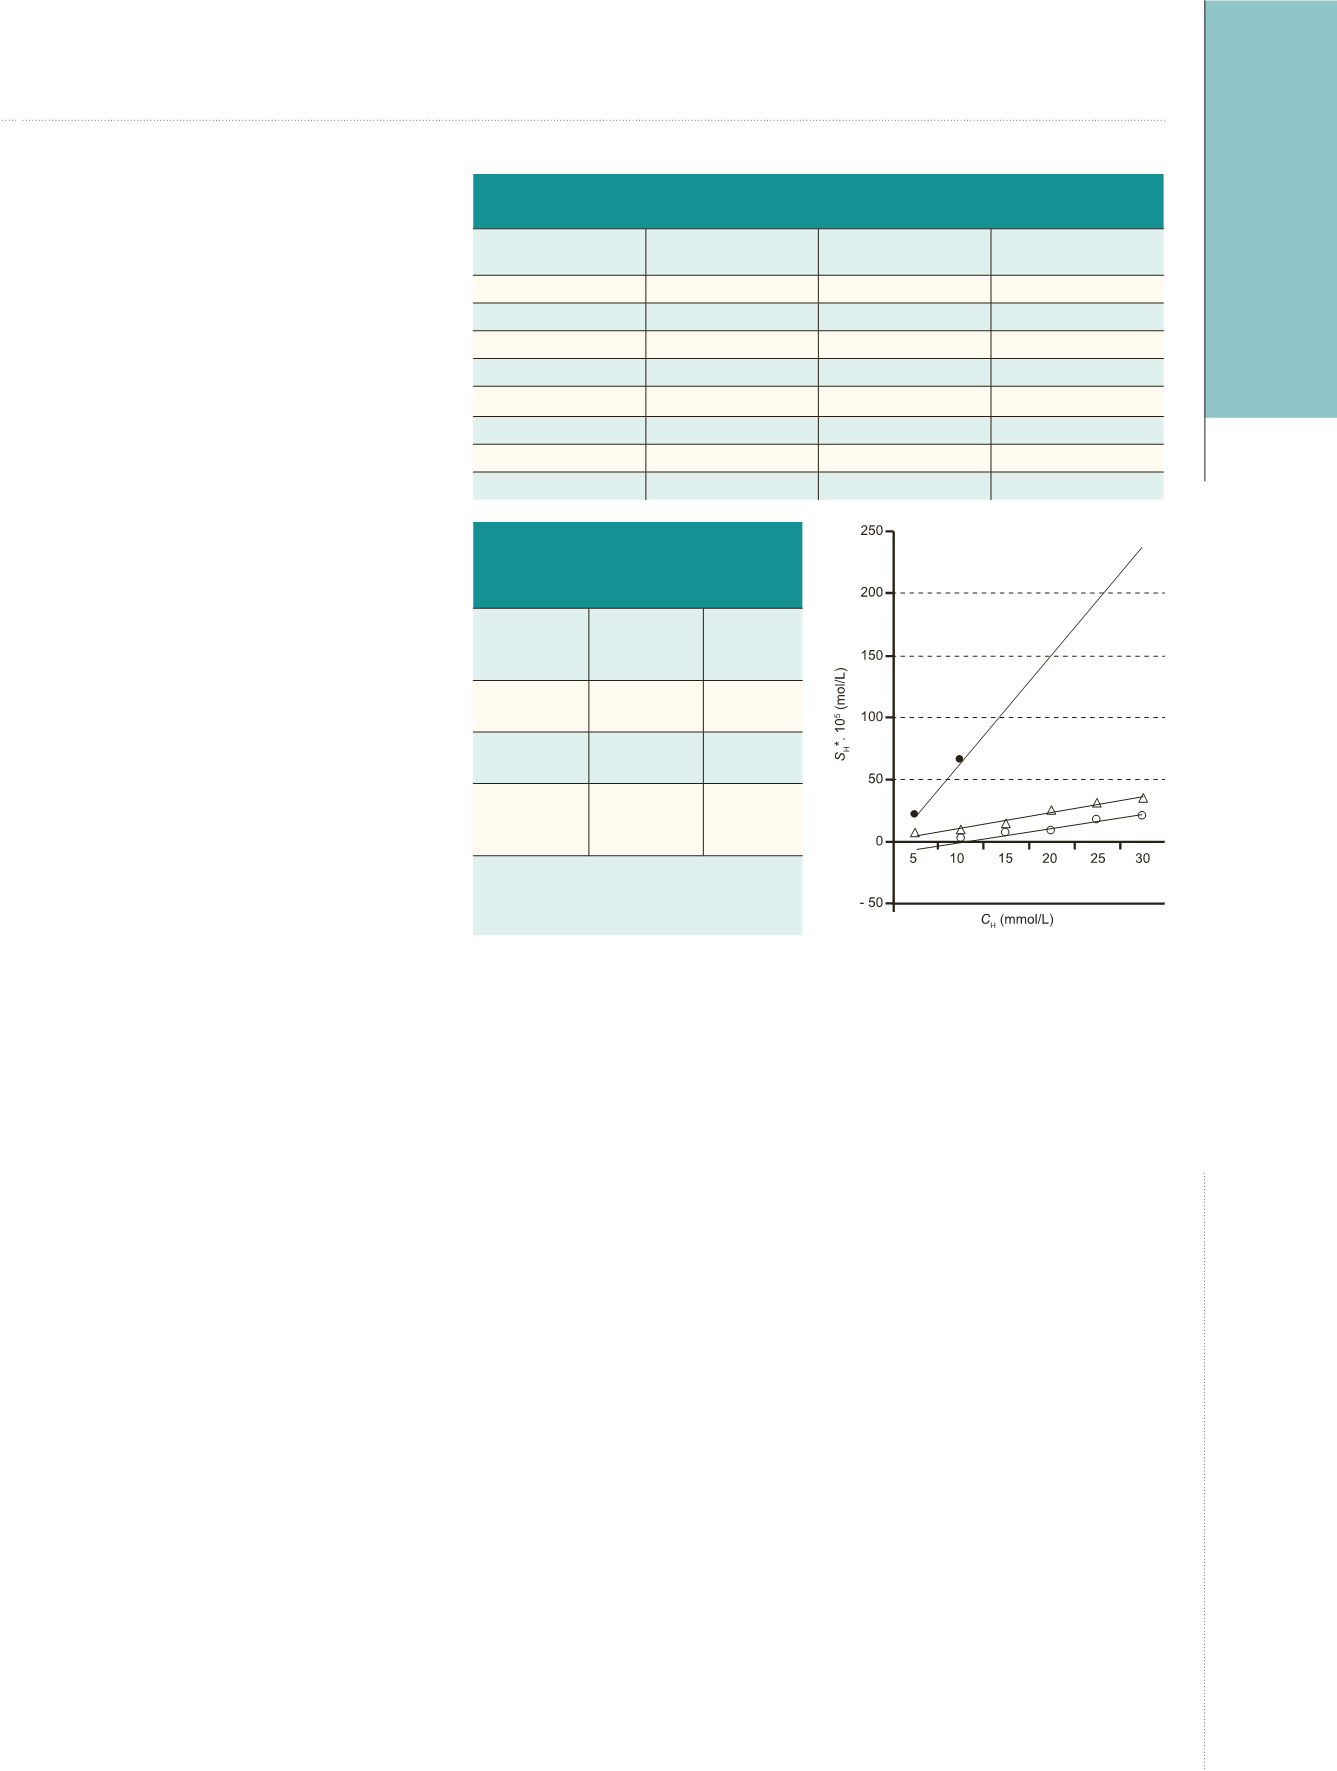
the analytical chemistry. When HA is
introduced into the same physiological
solution, a dramatic change in
solubility (up to 66 × 10
-5
mol/L) is
observed, as shown in Figure 1.
A similar effect of HA is also seen
in artificial urine in which distinct
supersaturation (due to the presence
of normal concentration of Ca
2+
and
medium concentration of C
2
O
4
2-
ions)
has been introduced (curves 2 and 3,
Figure 1). A linear dependence of the
solubility
C
H
is observed for each series
of measurements, in which 3 different
supersaturation values (zero, medium,
and normal) have been established.
The effect of the increasing
concentration of HA on the solubility
of CaOX-concrements is clearly
evident; the initially supersaturated
Atanassova SS, et al.
Regulation of Supersaturation in Calcium Oxalate Lithiasis
Figure 1.
Solubility of Calcium Oxalate
Calculi in Artificial Urine as a Function
of Hippuric Acid Concentration in 3
Physiological Solutions
•, solubility in zero saturation artificial urine
(curve 1); Δ, solubility in artificial urine with
lower saturation – 2.5 mmol/L Ca
2+
and
0.02 mmol/L C
2
O
4
2−
ions (curve 2); and 0,
solubility in artificial urine with “normal”
saturation as in “standard” human urine –
2.5 mmol/L Ca
2+
and 0.2 mmol/L C
2
O
4
2−
ions
(curve 3).


